ADF: DVT Charts based on a dynamic vo
In one of our latest projects we had the requirement to create a reporting feature that based on some filters we had to built a custom query and display those results in a chart.
In this post I will show you the approach we followed.
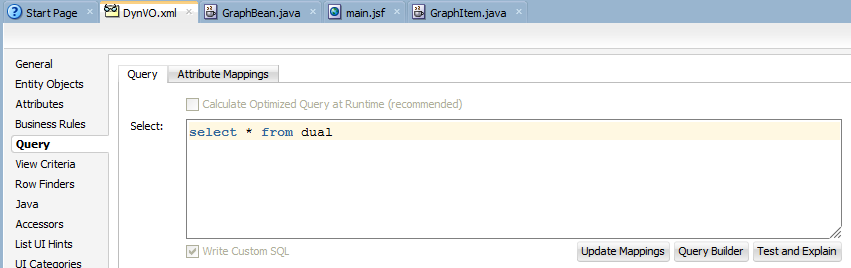
The first step is to create a dummy view object. We are going to use SELECT * FROM DUAL as its query.
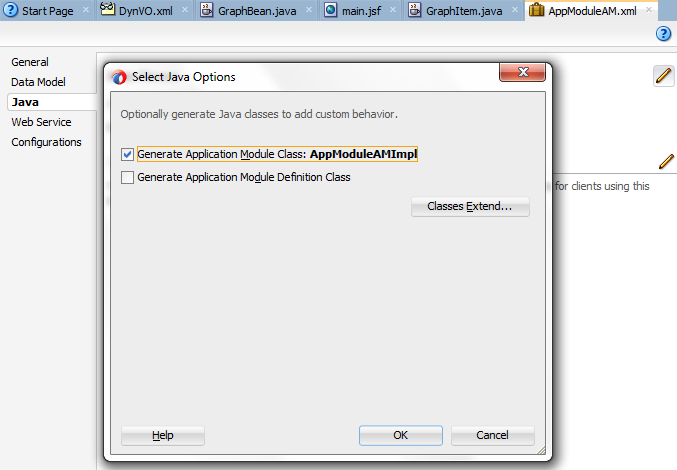
After this we need to add this view object to our Application Module data model and also create AM implementation class.
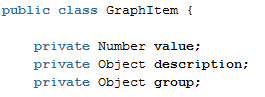
The main thing we are going to make is to create a List in our bean, based on a POJO that we will populate with our viewobject data.
We are going to add 3 attributes to our java class with their getter and setter methods.
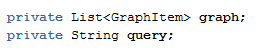
After that, in our page’s bean we need to create a couple of properties. The first one is the List that will hold the values, and that will be the value property of the graph, and the second one is a String that will be the value property of the input where we will introduce the query.
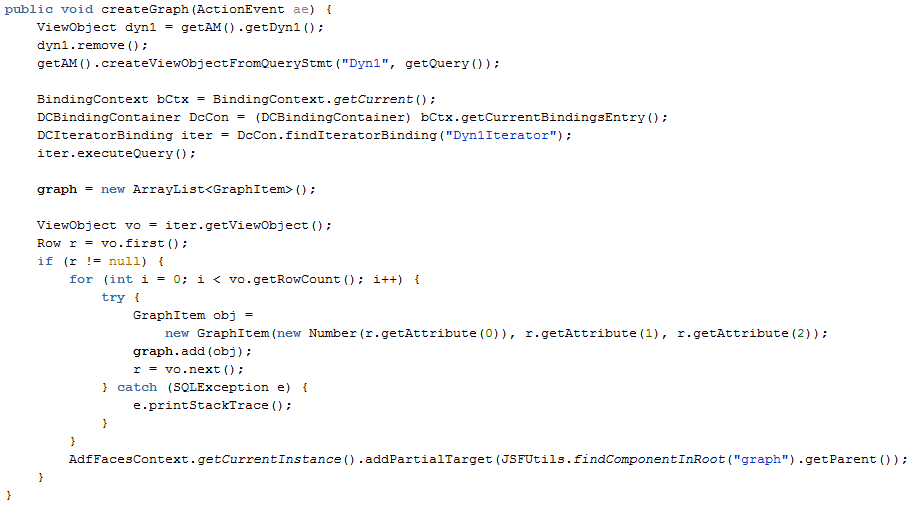
The next method of the bean is the one to create the graph.
The first three lines let us create the viewobject a runtime passing the query and the view object instance.
In the rest lines of our method we are just iterating the view iterator and populating the graph List object.
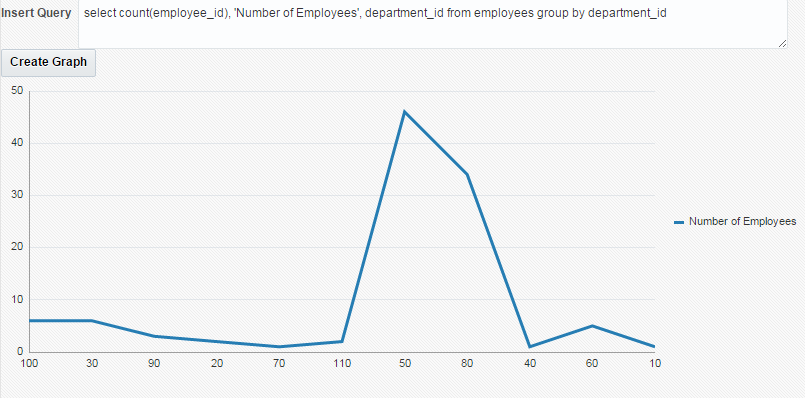
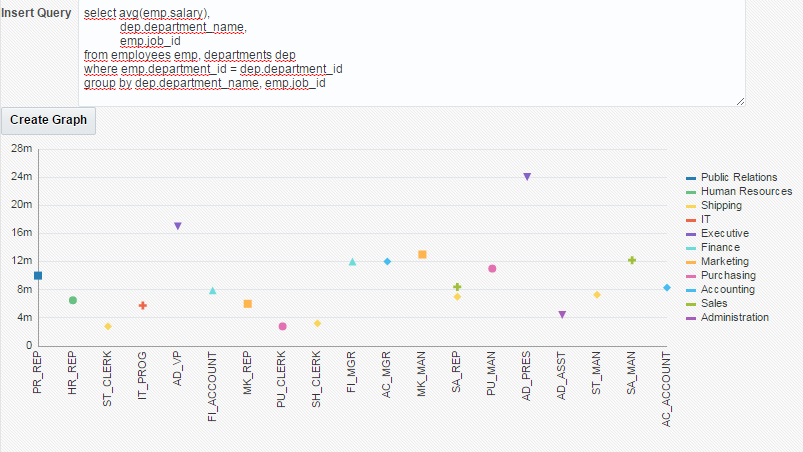
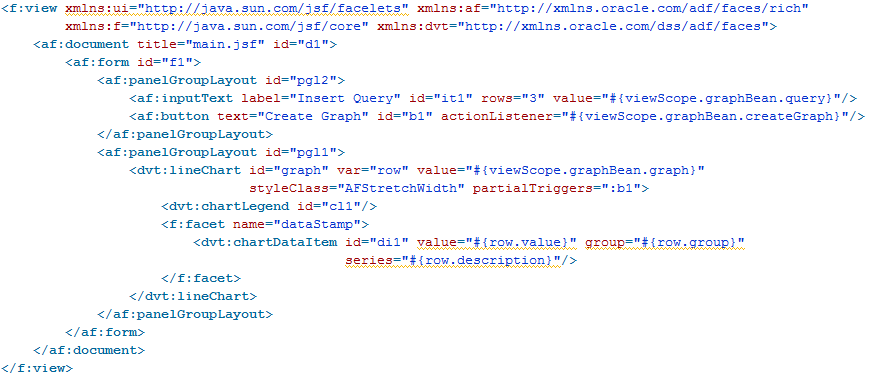
The last step is to create the page that will looks like this
In the page definition file associated to the page we have to create the iterator binding that we are using in the bean.
While testing if we use this query, we will see a graph with the data.